Top 10 Reasons To Use Infographic Marketing
Why go for infographic marketing?
Here are some interesting figures no marketing professional can ignore about infographic marketing:
-
A study by Xerox Corp says an infographic containing color increases people’s willingness to read by 80% (remember that when budgetary pressures are saying “monochrome only”)
-
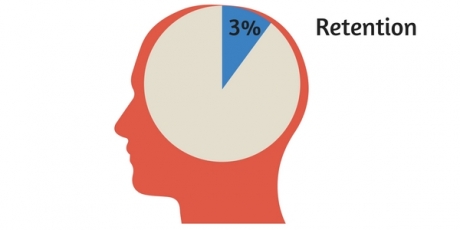 According to Discover Magazine, at any given time, 30% of the brain is processing visual information. The figure for hearing is 3% (which is why, three days after you tell someone something, they remember at most 10% of it).
 -
Reading as a form of visual information is much less easy to understand than pictures – the Nielsen Norman Group has done extensive work on eye tracking (studying what a website visitor looks at) and found that it’s the graphics people look at rather than the text.
-
Kissmetrics says having relevant images gets a page 94% more views. Just pause for a moment and repeat that to yourself. 94% more views! Do you want 94% more views for your website? Then you know what you have to do. But, just in case you’re still not convinced:
-
Massplanner says that infographics are liked and shared three times more often than any other type of content.
What is an infographic?
What is an infographic? An infographic is something that conveys information in graphical form. It uses a picture (or a flowchart, or a cartoon, or…well, almost anything, really, that can be shown in graphical form), to deliver a message.
So: information + graphic = infographic.
This, for example, is an infographic:

The information it conveys is: “Take care because you are in an area where rocks may fall.”
Okay, that’s a nice simple illustration of what an infographic is, but it’s not a lot of use unless you’re warning people to stay away from falling rocks. It certainly won’t help to sell anything (except, possibly, a hard hat). And contributing to selling things is the main reason to use infographic marketing.
The reasons to use infographic marketing
1. Making complex technical ideas easy to understand-
Here’s another infographic:

This illustrates the steps and hardware involved in an application for transmitting IoT commands and data over considerable distances by way of the Cloud. It does the job rather well – but can you imagine how hard it would be to convey those same ideas using only words? Let’s see; you might start like this:
“The application saves data to a hard disk before sending it to a concentrator. The concentrator is attached to a router, and the router can be any type – any make, any protocol, any kind of connector, any model. The data passes from the disk to the concentrator…”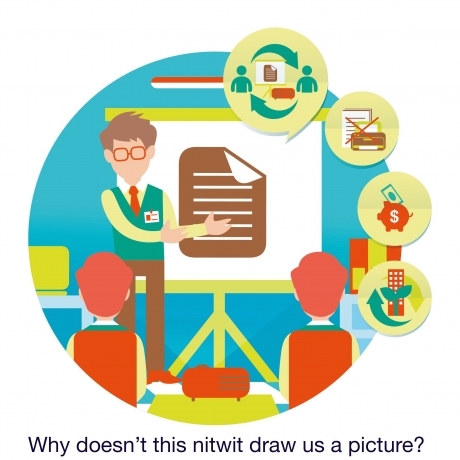
That’s 47 words, and you haven’t even begun to get into the meat of the application. How do you rate the chances of the reader staying with a purely text-driven explanation like that? I’ll answer for you: they’re not good.
And the reader will be thinking, “I can’t follow this at all. Why doesn’t this nitwit draw me a picture?”
You may like to know, by the way, that a research paper by W Howard Levie and Richard Lentz of Indiana University published in the Educational Communication and Technology Journal said that text and illustrations were more than 3 times as easy to understand as text alone. (In the paper, they say “323% more likely” instead of “more than 3 times as likely” and, if you want an example of how not to convey information, you have it right there).
2. Staying abreast of the competition-
Competition in every field gets tougher and tougher. You can probably ignore some of the people who think they compete with you – but there are others you have to take very seriously. You know who they are. Here’s another infographic:
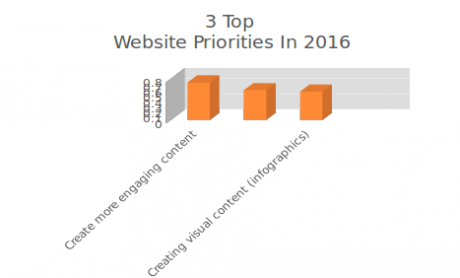
This is what some of the best online marketers in the world told the Content Marketing Institute they plan to focus on in 2016. 55% of your competitors plan to use infographics. They think it’ll give them an advantage over you. Now. Are you going to let them get away with that?
3. Improving sharing on social media-
A really good infographic that hits the scene at exactly the right moment can go viral. We’ve already quoted Massplanner to the effect that infographics are liked and shared three times more often than any other type of content. Buffer puts that figure even higher. Whichever of them is right; the like/share rate is significant – and that matters, because:
-
The search engines will see the likes, the shares and the click-throughs and your SERPS performance will improve; and
-
A good like and share performance enhances the trust level your online presence commands – and trust is probably the single most important factor in converting a waverer to a buyer.
Learn other social media engagement techniques.
4. Keeping visitors on the site-
There’s a lot of argument about what exactly “bounce rate” is and how much it matters, but why take chances? Clicky Analytics says a bounce is when someone stays on your site for less than 10 seconds.
Google says, no, someone can stay on your site for minutes but if they eventually leave without clicking through to another page, they’ve bounced. Well, as far as the Clicky definition goes, research shows that content without visuals holds a visitor for an average of 8 seconds – <BOUNCE> while enough good visuals can extend that to a matter of minutes. And as for Google, an infographic can be the perfect place for a clickable link. You win both ways!
If you want to lower your bounce rate, read this.
5. To make yours an authority website-
An authority website is one that contains good content and is trusted by experts in whatever field it is in. Make your infographics portable: provide the code that allows other websites to embed it and that code will provide a link back to your site. Google will notice that lots of different people are linking to your site and you will shoot up the rankings – which means more people searching for your keywords will find you.
6. To cross international boundaries-
Thanks to the Web, business today is global. If you’re, say, a plumber or electrician, then your customers are going to be sufficiently local for you to get there by road in an hour or so at the most – but if you’re selling a product or a service you may trade with someone on a different continent. And that person may not speak the same language as you.
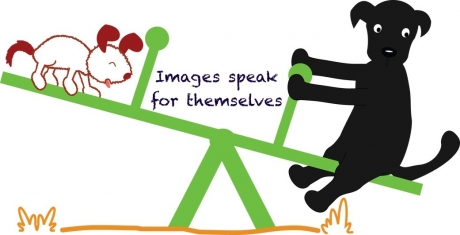
Their ability to read and understand your text content may be very limited – but pictures don’t have a language.
You can make connections, win friends, win customers, simply by showing them a picture or a series of pictures. Include facts, of course – but when facts are supported by pictures they can be put across in fewer words, yet say more.
If you want to know how to create a multilingual WordPress site, this guide is a must read.
7. To become the go-to company or person-
Writers of non-fiction books know that there is an authority that comes from being the person who wrote the book. In fact, there are books that are written purely for that purpose: not to make money themselves, but to acquire for the writer the reputation of being the leading authority in that field. Infographics can work the same way.
There are infographics that have become the standard illustration of a fact or a theory for whatever industry they relate to, and they are reproduced on the website. The knock-on effect can be substantial. One of the benefits of the web to the smaller company is that it can be a great leveler. If you publish an original infographic that catches the attention of people who buy from companies like yours, you are suddenly competing on a reasonably level playing field with organizations many times your size. (A good reason for making sure you have your logo and URL on your infographics).
8. To stand out from the crowd-
“Standing out from the crowd” is putting it mildly. Estimates of the number of new posts on the web vary between 1 million and 2 million. That’s every day. You want people to see your post. Of course, you do. So do the other 2 million posters. Not everyone is going to have their wish granted.
Of course, you’ll use all of the social media and other ploys to get people to your site, but then they have to stay there long enough to give you a chance to convert them. We’ve already written about the figures that say how much less likely you are to hold a visitor’s attention long enough to give you a chance of winning a new customer if there isn’t something attractive and non-textual on-screen.
9. To lead visitors down a particular track-

This infographic was used by a sales consultant to demonstrate to prospective clients his theory that a prospect did not become a customer until the order had been placed, the goods or service delivered, the invoice paid and a referral received. And, a target (what the consultant called a suspect) did not become even a 20% prospect – the lowest level the consultant recognized – until three criteria had been met:
-
The target had a problem;
-
The company had a solution; and
-
The target accepted that the company might have a solution.
But you could use that same infographic with different text to illustrate any five-point process that you wanted to talk your prospect through. Presented this way, it makes a nice change from the usual programmer’s flowchart.
Also see, 10 ways to generate leads using graphic design resources.
10. To build brand awareness
You went to a lot of trouble to create a brand image (and, if you didn’t, you should. Start today). You’ve got a logo, a typeface set, a color range that’s meant to define you. Using those things in the text is difficult; using them in infographics is as easy as rolling backward off a log.
Worth Reading : Best Infographic Techniques for WordPress site
You can create your own infographics
There’s no shortage of people prepared to create infographics for you, but have you thought of making your own? A lot of people are reluctant to do this because they see it as a job for the graphic artist, and we can see the sense in that – some people have the training and experience to use Adobe Illustrator, for example, without having to go through a learning process.
The drawback, of course, is that they don’t know your business the way you do. A detailed understanding of the message – what it is you’re trying to tell your prospective customer, and why it’s so important for your customer to hear that – is more important than facility with graphics software. Chances are, you can learn what you need to know about manipulating images faster than a graphic artist could learn what they needed to know about how your business works and why it works that way.
Don’t see this as like jumping off the high board at a diving pool with no preparation and all your clothes on. Take a look at what’s on offer here and ask yourself the questions:
-
Does that make sense?
-
And, if it does, could I use these templates to make my own infographics?
We think you’ll find that you answer both of those questions with “Yes.” And then you can enjoy some of the other benefits of DIY infographics. A/B testing, for example. Quick changes without having to wait for a designer to be available when something isn’t quite working or – more often – when a change in product detail or market conditions demands it. Immediate response to an emerging opportunity. Illustration of a new customer’s innovative way of employing your product or service.
And when you’ve created your own infographics, publish them and share them as much as you can. Make them work for you as infographic marketing have worked for so many others.
Leave a Reply